Blog Series: Tableau Data Analytics

The Power of Table Viz Extension
In today’s data-driven business environment, organizations face a unique challenge: balancing the familiarity of traditional reporting with the dynamic capabilities of modern analytics. Tableau’s Table Viz Extension emerges as the perfect solution, bridging this gap while enhancing your data presentation capabilities.
Why It Matters
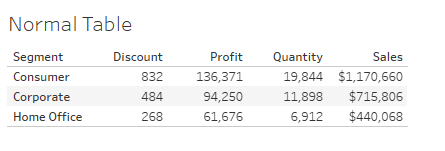
Traditional reporting methods have earned their place in business analytics for good reasons:
- Precise value representation
- Familiar spreadsheet-like formats
- Easy comparison of specific data points
However, modern data analysis demands more. The Table Viz Extension combines the best of both worlds by offering:
1. Enhanced Granular Analysis
The extension enables detailed data examination at the most granular level, providing clear, text-based representation while maintaining the interactive nature of Tableau dashboards.
2. Seamless Dashboard Integration
Users can now incorporate detailed tables and grid views directly into their dashboards, creating a more comprehensive analytical experience without sacrificing functionality.
3. Improved User Adoption
By providing familiar formats alongside modern capabilities, the extension helps organizations transition smoothly to more sophisticated analytics while keeping team members comfortable and productive.
Practical Applications
The Table Viz Extension shines in various scenarios:
- Financial reporting requiring exact figures
- Inventory management with detailed stock levels
- Transaction-level sales analysis
- Customer data review at individual record level
Implementation Best Practices
To maximize the benefits of the Table Viz Extension:
- Start with familiar layouts
- Introduce interactive elements gradually
- Maintain consistent formatting
- Provide clear documentation
- Invest in user training
The Bridge to Modern Analytics
The Table Viz Extension represents more than just a feature—it’s a strategic tool that helps organizations evolve their data visualization practices while maintaining efficiency and user satisfaction. Whether you’re handling financial data, operational metrics, or customer information, this extension provides the flexibility needed to serve diverse user preferences and requirements.
Steps on configuring a tableau Table
Prerequisite: You need 2024.3 version or above
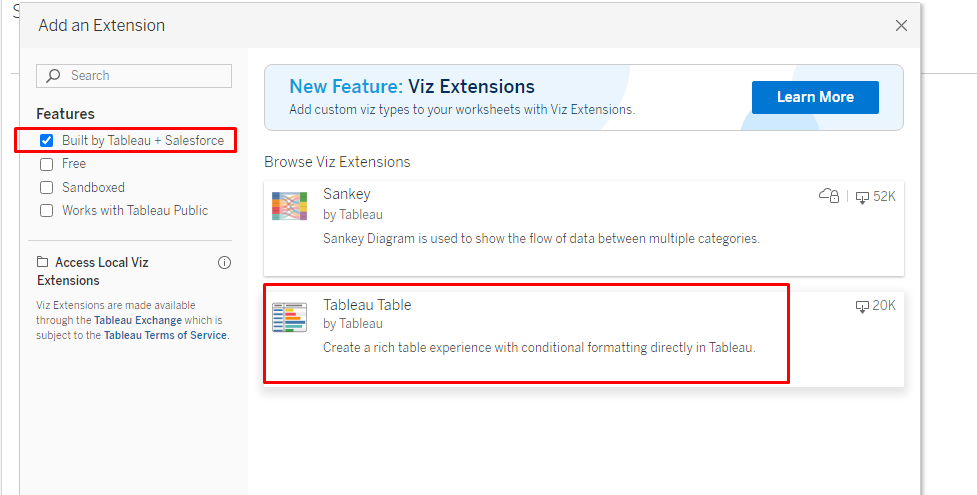
- Click on add extension in marks card
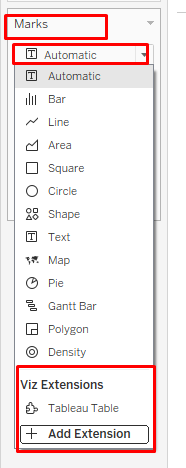
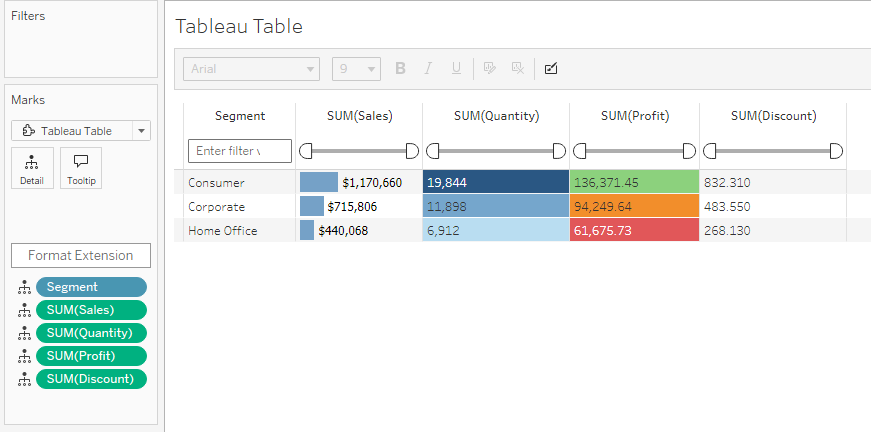
2. Add a Tableau Table extension
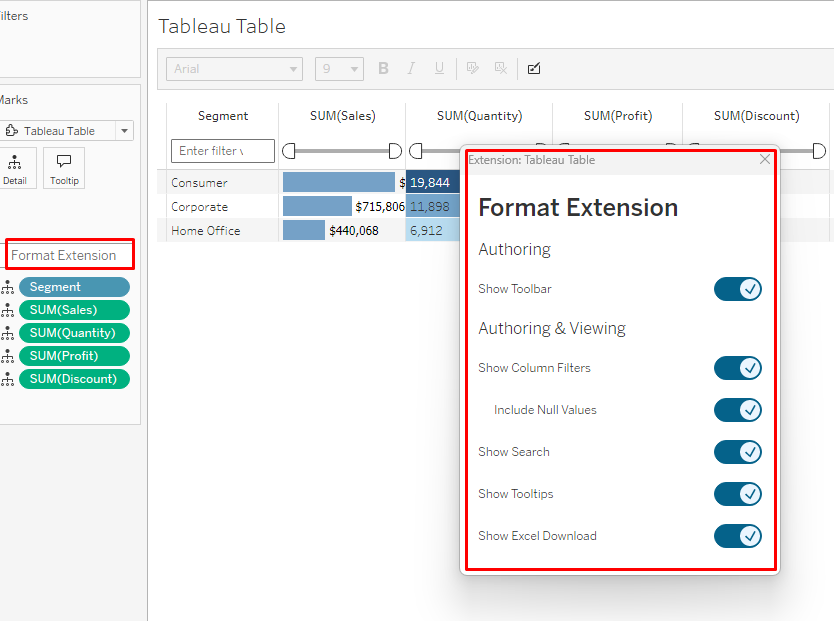
3. Drag fields to detail
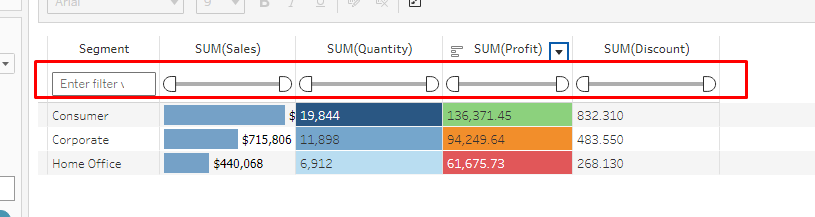
4. Format extension to show filters and search etc
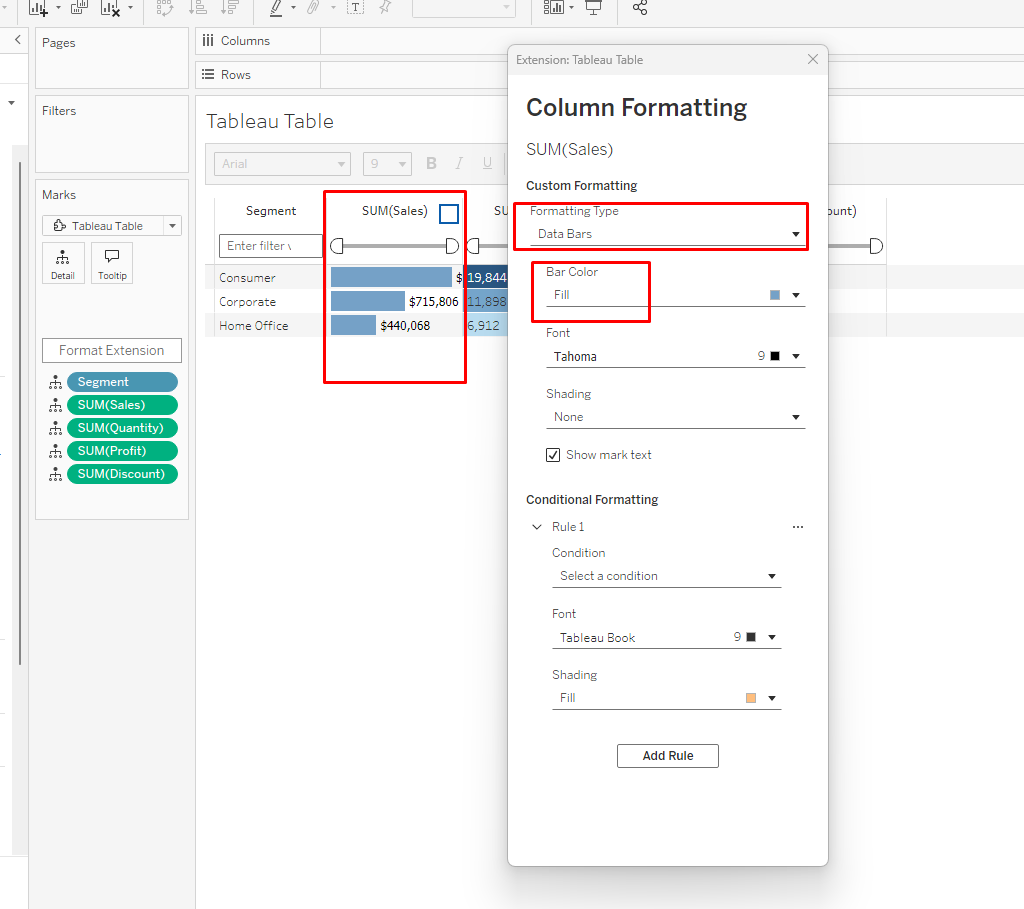
5. Show bars in the column
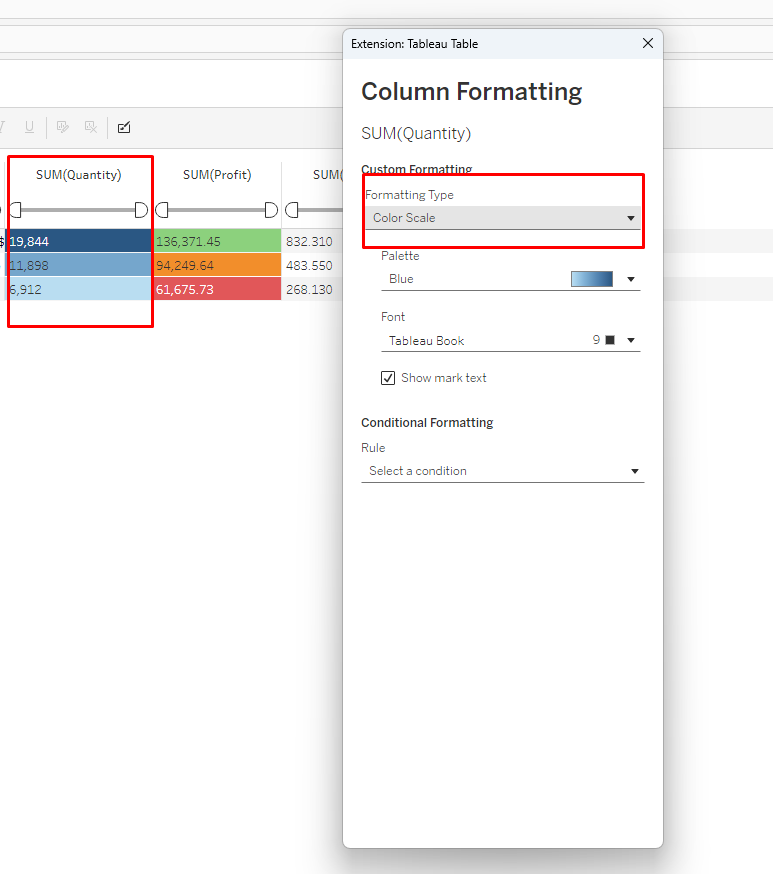
6. you can add a color scale for continuous measures
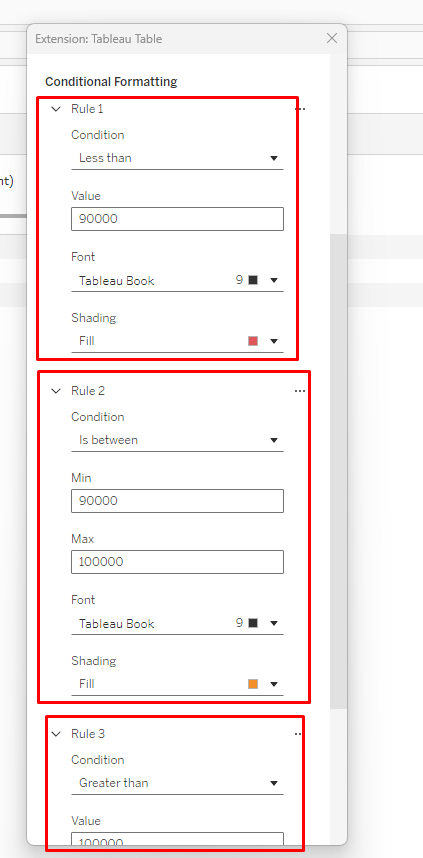
7. Conditional formatting based on values
8. Easily filter individual columns based on datatypes